1997 Dye Distribution
|
|
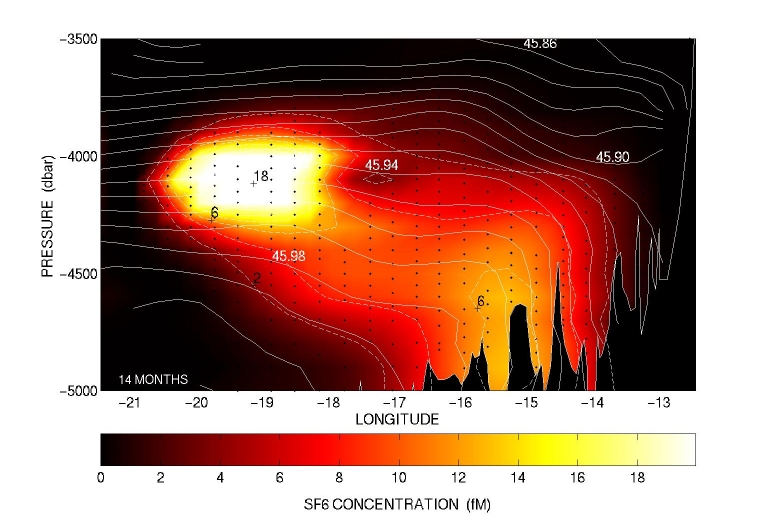
| Section of tracer concentration and potential density sigma_4 from the valley where the tracer was released obtained in 1997, 14 months after release. The dots show the sample locations, and the blue bar labelled 'INJ' shows the location and size of the initial patch. The bottom is from multibeam data gathered in 2000. The valley is enclosed by ridges to the north and south whose depths are roughly where the white density contours bend sharply down. The colors show tracer concentration: 1 fM = 10-15 M. |